 Log in

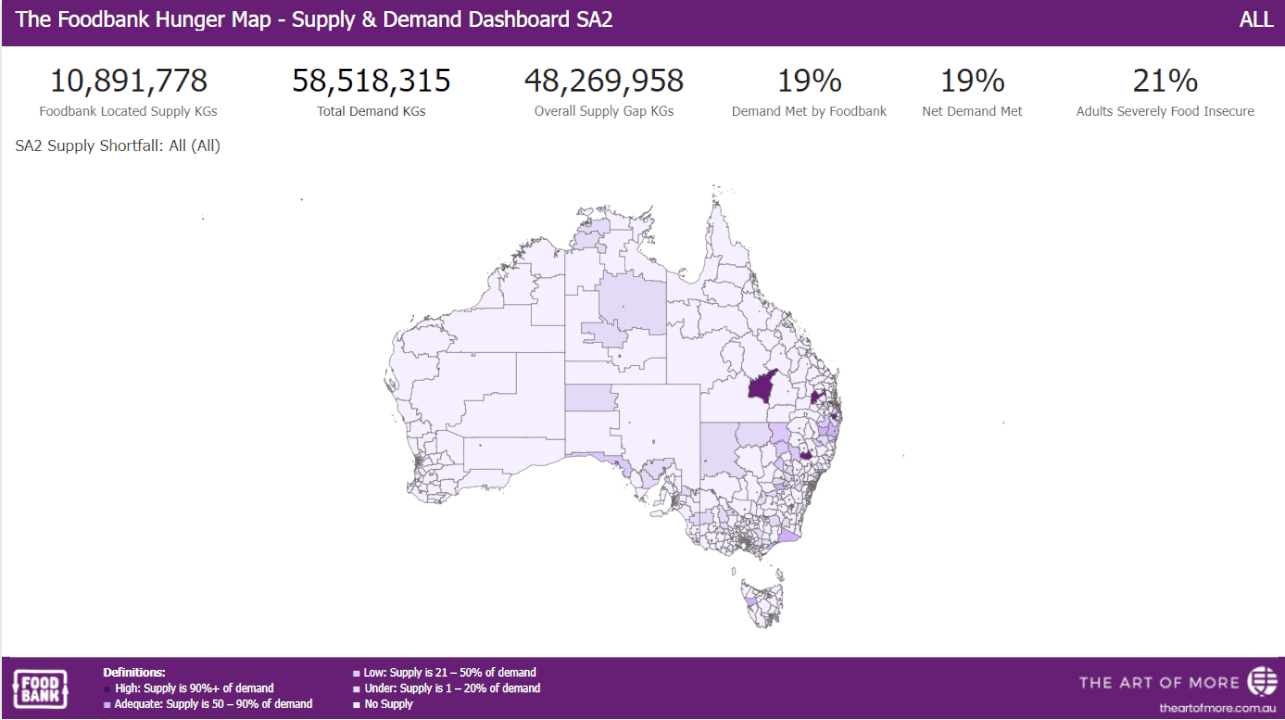
The Foodbank Hunger Map
About the map
The Foodbank Hunger Map brings the story of food insecurity to life, showing where households are struggling to put food on the table and where support is reaching them.
By mapping both need and help, the Foodbank Hunger Map helps us see the gaps – the places where demand is growing and where more support is urgently needed. It guides smarter decisions about where to invest, how to strengthen local services and where new infrastructure can make the biggest difference.
Most importantly, it helps Foodbank direct food and resources to the households and communities that need them most.
Our Approach
Behind the scenes, the Foodbank Hunger Map brings together a rich mix of information to build a clear, human picture of food insecurity across Australia.
It draws on more than 70 data sources and thousands of data points to understand the characteristics of communities and how these relate to food insecurity. Insights from the annual Foodbank Hunger Report help identify different “hunger segments” and the types of food relief people in those communities are most likely to need.
We then look at how food flows through the food relief system — mapping supply volumes to local charities and modelling how food is shared across communities. The result is a practical, evidence-based view of where food is reaching people, where it isn’t, and how the system can work better for those who rely on it.
Accessing Further Information
If you are interested in accessing further information beyond what available here, please fill in the form below and we will review your request and get back to you as soon as possible.
Go to form
Methodology
To view our methodology, click the button below. If you have further questions, please contact Foodbank Australia at research@foodbank.org.au.
Download
FAQs
Food Security Spectrum
Food Secure
1. High Food Security (highly food secure)
- Households have no problems with access to food.
- Consistently able to afford, access, and eat nutritious meals.
2. Marginal Food Security (marginally food secure)
- Some concerns or anxiety about running out of food.
- Food supply is stretched at times, but diets and meal sizes are not substantially reduced.
Food Insecure
1. Low Food Security (moderately food insecure)
- Households reduce the quality, variety, or desirability of their food.
- Diets may rely on cheaper, less nutritious foods.
- Food intake (amount) is usually maintained, but nutrition suffers.
2. Very Low Food Security (severely food insecure)
- Disrupted eating patterns and reduced food intake.
- People may skip meals, cut portion sizes, or go whole days without eating due to lack of money or resources.
The metadata document can be downloaded here
Licensing and Attribution
All publicly available Foodbank Hunger Map content and associated data are the intellectual property of Foodbank Australia.
The Foodbank Hunger Map content and data is licensed under a Creative Commons Attribution-NonCommercial-NoDerivatives 4.0 International (CC BY-NC-ND 4.0) license . Users must ensure that all use of Foodbank Hunger Map content is done within the limits of this licence.
Under this license you are free to:
- Share – copy and redistribute the material in any medium or format.
- Under the following terms:
- Attribution – You must give appropriate credit to Foodbank Australia (e.g., “Foodbank Australia, Hunger Map, [Year]”), provide a link to the license, and indicate if changes were made.
- NonCommercial – You may not use the material for commercial purposes.
- NoDerivatives – If you remix, transform, or build upon the material, you may not distribute the modified material.
Important note: This license applies only to the datasets and visualisations displayed publicly on the Hunger Map platform. Any additional, unpublished, or customised datasets provided by Foodbank Australia (for example, in response to a formal request) are not automatically covered by this license and may be subject to separate terms and conditions.
Acknowledgement
The Foodbank Hunger Map was enhanced through a co-investment partnership with the Australian Research Data Commons (ARDC) (DOI: 10.47486/DC107). The ARDC is enabled by the Australian Government’s National Collaborative Research Infrastructure Strategy (NCRIS).

More research & reports
Foodbank conducts a number of surveys annually including individuals experiencing food insecurity, charities and donations.
Read more